ARD processing with FORCE returns no results

I am trying to run the ARD processing with FORCE (and some of the advanced paramterisation regarding topo normalisation and BRDF) on the S2L1C collection. After various issues encountered previously, the notebook now run through but it does not generate any files that can be obtained/donaloaded

I get the following error after attempting to download the files:
OpenEoApiError: [500] unknown: [400] 400: Job output folder is empty. No files generated. (ref: 3a671628-0dbe-4398-b703-6711f5e7696e)

I paste below the entire process graph and here are the most important individual cells:

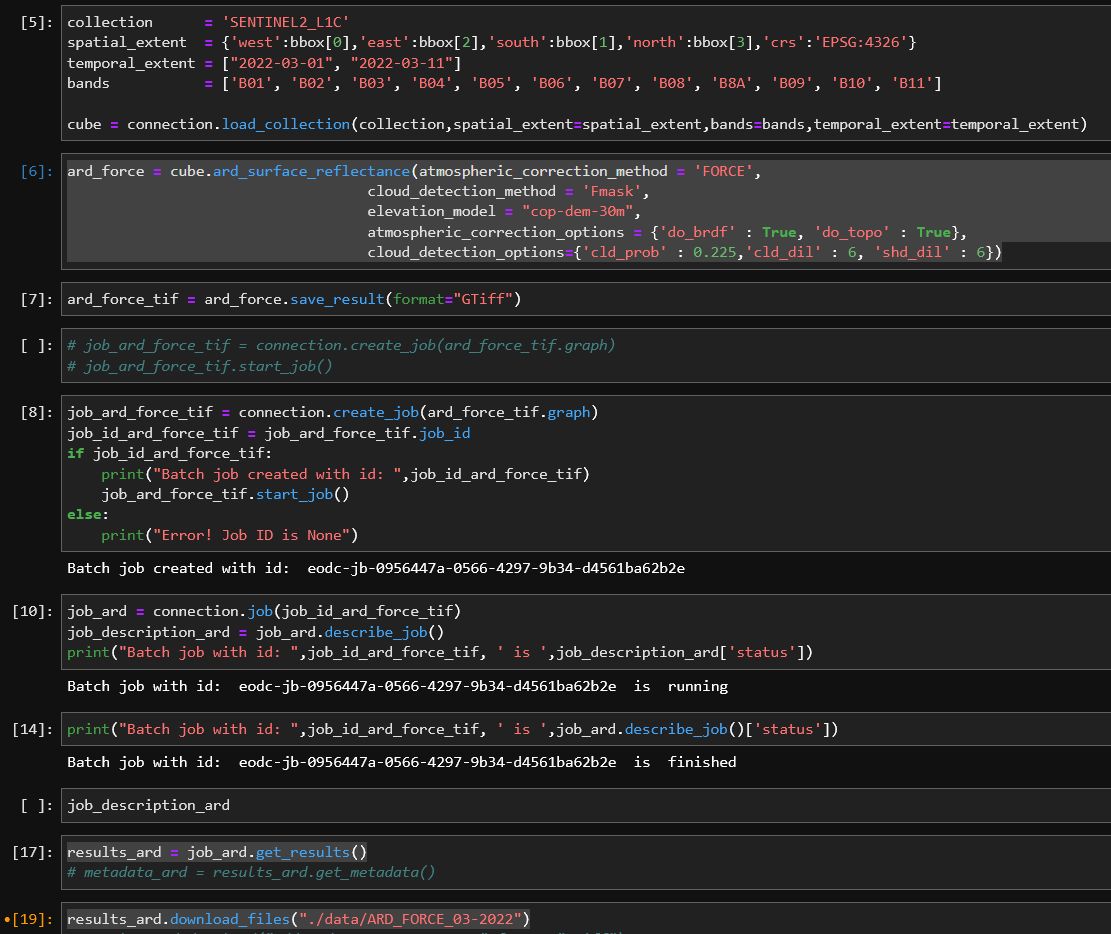
ard_force = cube.ard_surface_reflectance(atmospheric_correction_method = 'FORCE', 
                                   cloud_detection_method = 'Fmask', 
                                   elevation_model = "cop-dem-30m",
                                   atmospheric_correction_options = {'do_brdf' : True, 'do_topo' : True}, 
                                   cloud_detection_options={'cld_prob' : 0.225,'cld_dil' : 6, 'shd_dil' : 6})

ard_force_tif = ard_force.save_result(format="GTiff")
results_ard = job_ard.get_results()
results_ard.download_files("./data/ARD_FORCE_03-2022")
{
  "deprecated": false,
  "exceptions": {},
  "experimental": false,
  "id": "kJvV65UOGefmZ1y5",
  "process_graph": {
    "ardsurfacereflectance1": {
      "arguments": {
        "atmospheric_correction_method": "FORCE",
        "atmospheric_correction_options": {
          "do_brdf": true,
          "do_topo": true
        },
        "cloud_detection_method": "Fmask",
        "cloud_detection_options": {
          "cld_dil": 6,
          "cld_prob": 0.225,
          "shd_dil": 6
        },
        "data": {
          "from_node": "loadcollection1"
        },
        "elevation_model": "cop-dem-30m"
      },
      "process_id": "ard_surface_reflectance"
    },
    "loadcollection1": {
      "arguments": {
        "bands": [
          "B01",
          "B02",
          "B03",
          "B04",
          "B05",
          "B06",
          "B07",
          "B08",
          "B8A",
          "B09",
          "B10",
          "B11"
        ],
        "id": "SENTINEL2_L1C",
        "spatial_extent": {
          "crs": "EPSG:4326",
          "east": 16.198021,
          "north": 45.818592,
          "south": 43.474184,
          "west": 3.236323
        },
        "temporal_extent": [
          "2022-03-01",
          "2022-03-11"
        ]
      },
      "process_id": "load_collection"
    },
    "saveresult1": {
      "arguments": {
        "data": {
          "from_node": "ardsurfacereflectance1"
        },
        "format": "GTiff",
        "options": {}
      },
      "process_id": "save_result",
      "result": true
    }
  }
}

Hi Patrick,

Thanks for sharing and posting to the forum. It looks like the process graph is in the correct order, the ard surface reflection node is before the load collection node. Our back-end currently is not smart enough to re-order the nodes that will be processed on the back end (potentially something we will consider in the future).

The following example reflects how the process graph should be formatted.

{
    'loadcollection1': {
        'process_id': 'load_collection',
        'arguments': {
            'bands': [
                    'B01',
                    'B02',
                    'B03',
                    'B04',
                    'B05',
                    'B06',
                    'B07',
                    'B08',
                    'B8A',
                    'B09',
                    'B10',
                    'B11'
            ],
            'id': 'SENTINEL2_L1C',
            'spatial_extent': {
                    'west': 3.236323,
                    'east': 16.198021,
                    'south': 43.474184,
                    'north': 45.818592,
                    'crs': 'EPSG:4326'
                    },
            'temporal_extent': ['2021-08-01', '2021-08-24']
        }
    },
    'ardsurfacereflectance1': {
        'process_id': 'ard_surface_reflectance',
        'arguments': {
            'atmospheric_correction_method': 'FORCE',
            'atmospheric_correction_options': {'do_brdf': True, 'do_topo': True},
            'cloud_detection_method': 'Fmask',
            'cloud_detection_options': {'cld_prob': 0.225, 'cld_dil': 6, 'shd_dil': 6},
            'data': {'from_node': 'loadcollection1'},
            'elevation_model': 'cop-dem-30m'
            }
        },
    'saveresult1': {
        'process_id': 'save_result',
        'arguments': {
            'data': {
                'from_node': 'ardsurfacereflectance1'},
        'format': 'GTiff',
        'options': {}
        },
        'result': True}
}

I am not sure why the load collection is appearing after the ard surface reflectance, but be sure to apply load collection, the chosen processing, and then save result for a well formatted graph!

Thanks Sean, I only now realised that the PG shows the ARD beofre load collection.

The strange thing is, that the PG was created automatically based on my JN.
and in the JN the load collection cell clearly comes before the ARD process cell.
See attached JPG.

So is there an issue with translating from JN into PG??

This is indeed peculiar, can you share the version of the openeo-client you are running?

Run the following in the notebook

openeo.__version__

Hi Sean,
if I read the process graph docs:
https://api.openeo.org/#section/Processes/Process-Graphs
It doesn’t seem to say anything about order, and in fact a DAG is more complex than an ordered list of processes.
Isn’t this simply a bug in the parser?

thanks,
Jeroen

‘0.9.1’

Hi Jeroen,

I didn’t know this, so thanks for bring it to my attention. @patrick.griffiths I have just ran that process graph in order to test the inference I made about order being relevant, and it seems it isn’t, the job has been formatted to run in the correct order for our backend. I will keep track of this job and see if it outputs no results, and whether I can catch any suspect logs.

I also created the graph using 0.9.1, so the client shouldn’t be the cause of the strange order we saw.

Best,

Yes, that is likely a bug in the parser. Process graph nodes can’t have an order in JSON as JSON objects themselves are unordered (the [string] representation may print them in a certain order, but that’s an implementation detail of the JSON parser). Do never rely on the order of a JSON object! A client can output any order and the back-end needs to order tasks based on dependencies formulated through the from_node construct. Is this an issue in openeo-pg-parser-python?

1 Like

To reiterate, after making the initial inference about order yesterday, I re-ran the process-graph submitted by Patrick. The job ran correctly and all of the nodes were correctly parsed by the back-end, so my initial inference about order was wrong. That being said, I am still not still not clear as to the cause of the original issue, which I am still looking into.

1 Like

… The job ran correctly …

Hi Sean, does that mean the result files were generated successfully this time?
The process completed previously, but did not generate any data…

Hi Patrick!

I have just checked the test run I submitted yesterday, I do indeed have the result files. I will run a couple more tests and see if I am able to re-create the original issue somehow. :slight_smile:

Best,

The parser works fine, I haven’t experienced similar issues until now. And as Sean reports, the issue does not come from the ordering.

Hey @sean.hoyal
Today I re-run the process, and it was running fine.
Next time I checked the job had disappeared from the Editor batch job monitoring
and in the JN the job is suddenly unknown:

OpenEoApiError: [404] JobNotFound: The batch job ‘eodc-jb-1e0f8dd0-4fe3-4416-9269-88b3561b56e9’ does not exist.

Some more evidence from the batch job instance monitoring below.
Could you take a look what is going on here?

2022-03-23 14:31:49,578] {{taskinstance.py:655}} INFO - Dependencies all met for <TaskInstance: jb-1e0f8dd0-4fe3-4416-9269-88b3561b56e9.odc_indexing 2022-03-23T12:55:14+00:00 [queued]> [2022-03-23 14:31:49,609] {{taskinstance.py:655}} INFO - Dependencies all met for <TaskInstance: jb-1e0f8dd0-4fe3-4416-9269-88b3561b56e9.odc_indexing 2022-03-23T12:55:14+00:00 [queued]> [2022-03-23 14:31:49,609] {{taskinstance.py:866}} INFO - -------------------------------------------------------------------------------- [2022-03-23 14:31:49,609] {{taskinstance.py:867}} INFO - Starting attempt 1 of 1 [2022-03-23 14:31:49,609] {{taskinstance.py:868}} INFO - -------------------------------------------------------------------------------- [2022-03-23 14:31:49,633] {{taskinstance.py:887}} INFO - Executing <Task(PythonOperator): odc_indexing> on 2022-03-23T12:55:14+00:00 [2022-03-23 14:31:49,643] {{standard_task_runner.py:53}} INFO - Started process 1142793 to run task [2022-03-23 14:31:49,752] {{logging_mixin.py:112}} INFO - Running %s on host %s <TaskInstance: jb-1e0f8dd0-4fe3-4416-9269-88b3561b56e9.odc_indexing 2022-03-23T12:55:14+00:00 [running]> f9e17c78fd79 [2022-03-23 14:31:56,186] {{logging_mixin.py:112}} INFO - Indexing datasets… [2022-03-23 14:31:56,187] {{python_operator.py:114}} INFO - Done. Returned value was: None [2022-03-23 14:31:56,215] {{taskinstance.py:1048}} INFO - Marking task as SUCCESS.dag_id=jb-1e0f8dd0-4fe3-4416-9269-88b3561b56e9, task_id=odc_indexing, execution_date=20220323T125514, start_date=20220323T143149, end_date=20220323T143156
info ID: 138_odc_indexing

dear @sean.hoyal @christian.briese,

after there was no response on my above attempt, I tried to run this JN again.
Job ID: eodc-jb-abadbce3-ebdc-4546-8844-5083ed0ce38e
It again finished without error, but did not produce any results:

OpenEoApiError: [500] unknown: [400] 400: Job output folder is empty. No files generated. (ref: 87058b79-3509-401d-b1f3-4bdf9e00f3a4)

Please, look into this!

Hi Patrick!

On Friday evening I re-ran the process graph and the results where created as expected. Would you be free for 30 minutes or so in the next couple of days? It may be beneficial to jump on a call and take a look at the notebook together, see if we can either reproduce the errors you’ve experienced, or produce the expected output!

Update regarding the process graph submitted here. After some investigation is seems as though it runs, but the lack of output is down to the options object in ard_surface_reflectance.

Original example:

"ardsurfacereflectance1": {
  "arguments": {
    "atmospheric_correction_method": "FORCE",
    "atmospheric_correction_options": {
      "do_brdf": true,
      "do_topo": true
    },
    "cloud_detection_method": "Fmask",
    "cloud_detection_options": {
      "cld_dil": 6,
      "cld_prob": 0.225,
      "shd_dil": 6
    },
    "data": {
      "from_node": "loadcollection1"
    },
    "elevation_model": "cop-dem-30m"
  },
  "process_id": "ard_surface_reflectance"
}

Suggested replacement:

  'ardsurfacereflectance1': {
      'process_id': 'ard_surface_reflectance',
      'arguments': {
          'atmospheric_correction_method': 'FORCE',
          'atmospheric_correction_options': {'do_brdf': True, 'do_topo': True},
          'cloud_detection_method': 'Fmask',
          'cloud_detection_options': {'cld_prob': 0.225, 'cld_dil': 6, 'shd_dil': 6},
          'data': {'from_node': 'loadcollection1'},
          'elevation_model': 'cop-dem-30m'
          }
      }

The second option is producing the expected output files. I haven’t been involved with the options ard notebook, I see there are two possible job runs, each with differing objects. So, the notebook needs to be updated if the first options object is no longer supported. I will discuss this internally and respond, as I think one of my colleagues may have been aware of this change.

What’s the difference? I can’t spot the difference between the two examples (except that the first is a JSON and the second is Python syntax, so it is not a drop in replacement)?

You’re totally right, for a minute I thought I posted the wrong example then, but the only difference is the ordering, which shouldn’t matter. Though, this still seems to be the only difference between two process graphs where I can get output for one, and not for the other (and no error logs being shown). I’ll validate this behaviour with a few more runs (to check the initial behaviour wasn’t a fluke or something).