Dear,
Is it possible to specify what kind of data visualizes in the editor?
From this input for example:
datacube = session.load_collection(
“SENTINEL2_L2A”,
spatial_extent={“west”: 2, “south”: 42, “east”: 2.15, “north”: 42.15},
temporal_extent=[“2019-01-01T00:00:00.000Z”, “2019-01-31T23:59:59.999Z”],
bands=[“B04”, “B08”,“SCL”],
properties={“eo:cloud_cover”: lambda cc:lte(cc, 80 )}
)
Only I wanted to visualitze an output image, for example datacube2 = datacube.max_time() or other kind of process.
Is possible to define in if job.job_id:
print(job.job_id)
print(job.start_job())
print (job.describe_job())
else:
print(“Job ID is None”)
I’m not sure I completely understand because you mention “editor” (which usually means https://editor.openeo.cloud/), but from your code snippets I infer that you are working in a jupyter notebook environment. Is that correct?
Anyway, this kind of easy/automatic visualization is still an experimental feature. For now I would recommend to download the job result (e.g. with job.get_results().download_files("output-folder") ) as local files and work from these (e.g. visualize through rasterio/xarrio in your notebook, or use a tool like QGIS)
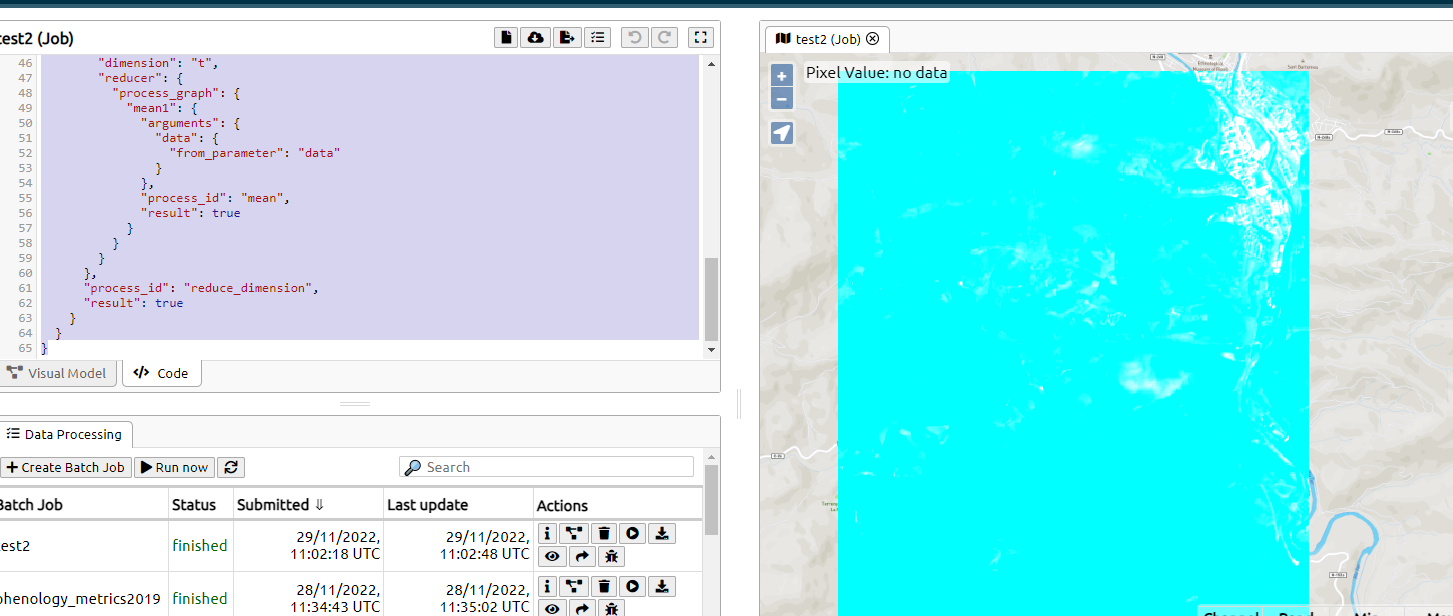
@i.serra if you would like to have an interactive look at the data itself, you could indeed use the Web Editor (editor.open.cloud), where you could define a process graph and directly see the result. This is an example using the extent you have provided and taking the minimum over the month of January 2019:
print(datacube.to_json())
or datacube.print_json()
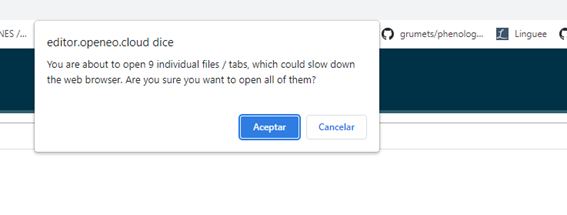
From the message I understand that the platform generates multiple files as a result and therefore the viewer might not be able to visualize them correctly.
@m.mohr what happens if we have multiple files as results and we try to visualize them?
The Editor tries to open as many tabs/maps as there are files available, here 9.
As opening multiple COGs might be demanding for slower computers the warning above is shown.
There’s a feature request to show them on a single map, but this will take a bit more time: