Reduce_dimension using count

Hey all,

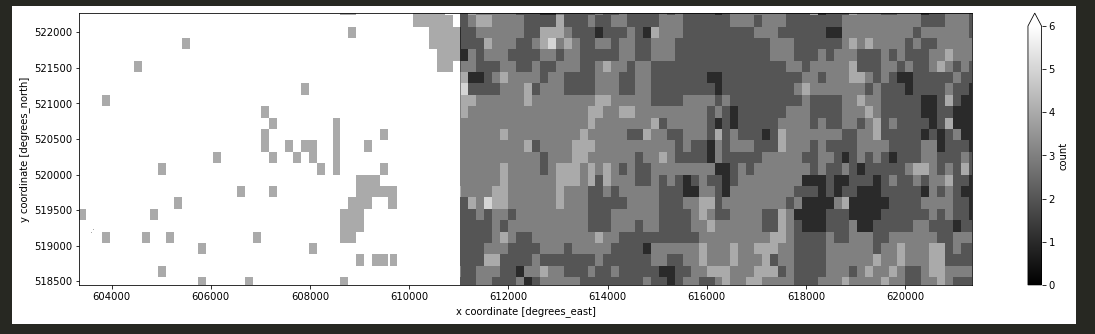
Please can you advice, why after applying reduce_dimension(reducer = "count", dimension = "t") , the ouput data shows an incorect values in final raster, mainly in the left side of image?

I aim to reduce the dimension of a datacube by calculating the number of images with a valid no-mask value at each pixel across the stack of B02 band, e.g., in this case we have 6 scenes so the final raster should have the max value equal 6 but many scenes are masked so pixels should reach values below 6.

## Get the Sentinel-2 data for a 3 month window.
start_date = '2021-01-01'
end_date = '2021-01-31'
spatial_extent  = {'west': -74.06810760, 'east': -73.90597343, 'south': 4.689864510, 'north': 4.724080996, 'crs': 'epsg:4326'}

s2_cube = connection.load_collection(
    'SENTINEL2_L2A_SENTINELHUB',
    spatial_extent = spatial_extent,
    temporal_extent = [start_date, end_date],
    bands = ['B02', 'B03', 'B04', 'B08', 'CLP', 'SCL', 'sunAzimuthAngles'] )

clp = s2_cube.band("CLP")
mask = (clp / 255) > 0.3 
s2_cube = s2_cube.mask(mask)

ds_s2_cube_v1 = xr.open_dataset("s2_cube_v4.nc").load()
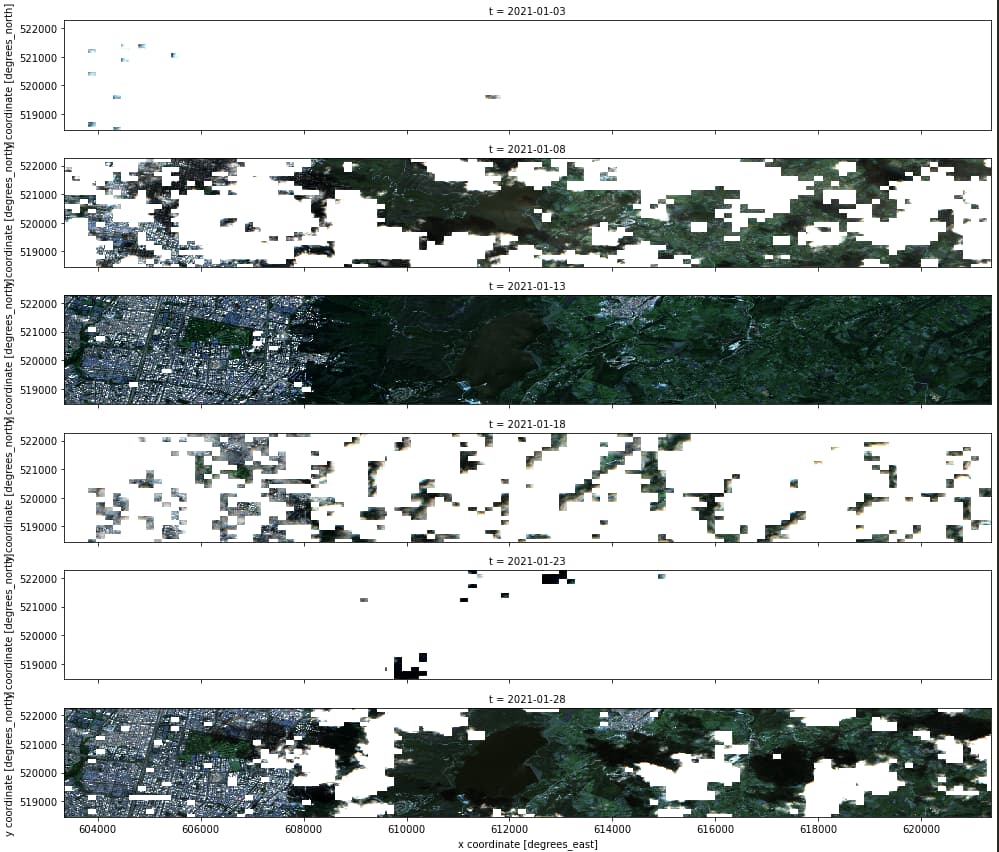
ds_s2_cube_v1[['B02', 'B03', 'B04']].to_array().plot.imshow(x="x", robust=True, col ="t", col_wrap=1,vmin=0, vmax=3000, figsize=(14, 6)); 

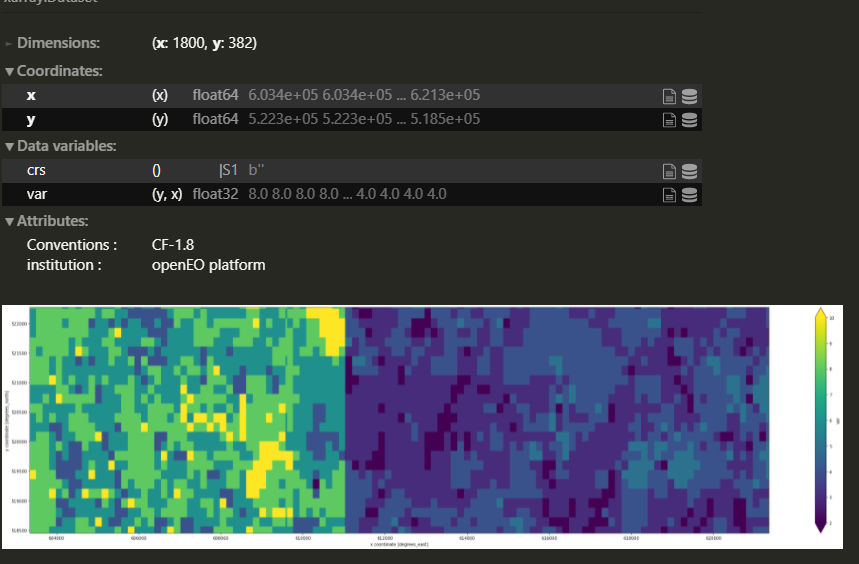
s2_count = s2_cube.filter_bands(bands = ["B02"]).reduce_dimension(reducer = "count", dimension = "t")
s2_count = s2_count.add_dimension("bands", "count", type = "bands") 

ds_s2_cube_count_v2 = xr.open_dataset("s2_count_V4.nc").load()
ds_s2_cube_count_v2['count'].plot.imshow(x="x", robust=True, cmap='gray', col_wrap=5,vmin=0, vmax=6, figsize=(20, 5)); 

S2 RGB scenes after cloud masking look like these:

The final output:

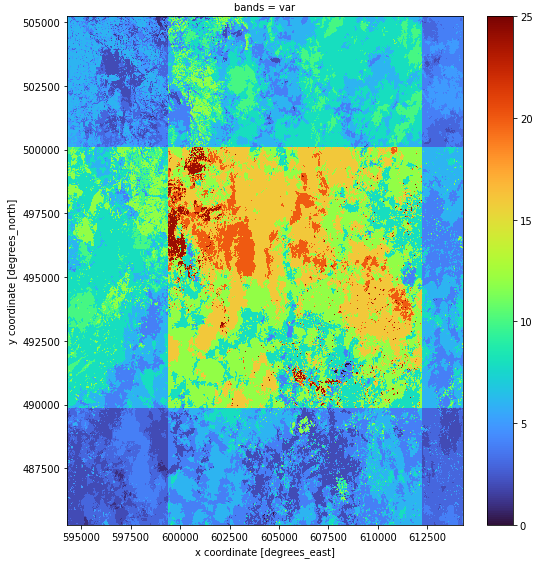
The same ouput with the different scale:

What back-end are you using? Because at the moment, nor with openeo.vito.be, nor with openeo-dev.vito.be I can not reproduce your final result. It looks even worse than your result:

openeo-dev.vito.be

I think I’ve identified and fixed (part of) the problem: bug: reduce_dimension with `count` callback · Issue #65 · Open-EO/openeo-geotrellis-extensions · GitHub
Now we have to wait for a successful build to test this on the dev backend

There is also a part of the problem in the openeo python client, which I’m still figuring out.

In the meantime, a workaround to get the number of valid pixels is doing a temporal reduce of the mask with sum reducer

for example

# note: `*1.0` trick to convert boolean to float and workaround a netCDF saving issue 
mask_sum = (mask*1.0).reduce_dimension(reducer="sum", dimension="t")

mask_sum.download("mask_sum.nc")

Issue in openeo client is tracked here: Support for second order "callbacks" · Issue #317 · Open-EO/openeo-python-client · GitHub

Hey Stefaan,
I’ve tried wiht sum but it seems the same problem as with count.

This is the first part:

## Get the Sentinel-2 data for a 3 month window.
start_date = '2021-01-01'
end_date = '2021-01-31'
spatial_extent  = {'west': -74.06810760, 'east': -73.90597343, 'south': 4.689864510, 'north': 4.724080996, 'crs': 'epsg:4326'} 

s2_cube = connection.load_collection(
    'SENTINEL2_L2A_SENTINELHUB',
    spatial_extent = spatial_extent,
    temporal_extent = [start_date, end_date],
    bands = ['B02', 'B03', 'B04', 'B08', 'CLP', 'SCL', 'sunAzimuthAngles'] )
s2_cube.download("s2_cube_test.nc")

Output:

clp = s2_cube.band("CLP")
mask_clp = (clp / 255) > 0.3 

Ouput mask_clp:

sum_clp = mask_clp.reduce_dimension(reducer="sum", dimension="t")

output of sum_clp :

I have tried to multiply it by 1 but I got the same results:

sum_clp_1 = (mask_clp*1).reduce_dimension(reducer="sum", dimension="t")

So it is not working properly for both

The question is also if there is really an issue here: maybe the left side of your bbox just has more observations (tiles) than the right hand side, which would cause a structural difference in “count” of valid mask values

FYI: I did my testing in a different area of interest too (where I didn’t cover a tiling edge like you might have with your area of interest)

We have the 2 overlapped tiles (6 scenes left and 6 scenes right) in Bogota so we have more scenes on left (overlapping area) than the right part. This means the sum function shows good results eventually. However, a data cube (see image S2 RGB plot) shows only the full coverage {6 scenes in total} and this is little bit misleading. maybe it is better to show all images?
image

To sum it up: the count reducer shows the wrong calculation but sum works fine

I also did some more digging into this and came to same conclusion.
The reason for the band pattern in both the mask-sum image and the masked-data-count image is indeed because of this overlap in tiles around the Bogota area:

To illustrate, I did the mask-sum image in an different AOI, slightly moved to the west to cover across the overlap, showing a “factor 2 effect” in the overlap region:

The reason for this is that in our internal data cube contains both observations of each pair of tiles. Doing the reduce_dimension with count(valid) or sum(mask) exposes this duplicate data. When you download the datacube as NetCDF for example, the data is de-duplicated (to one observation per day) because we want to provide one stitched image per day.

Regarding the count bug: that is now fixed in dev (openeo-dev.vito.be) reduce_dimension with count should now work properly.

One remark though, as discussed in Support for second order "callbacks" · Issue #317 · Open-EO/openeo-python-client · GitHub, there is a client bug in the handling of an expression like

s2_count = s2_cube.reduce_dimension(
    reducer="count", 
    dimension="t"
)

With client version up to 0.10.1 (latest at time of this writing), this gives possibly wrong results.
It can be worked around by writing it as:

s2_count = s2_cube.reduce_dimension(
    reducer=lambda data: data.count(), 
    dimension = "t"
)

Starting with the next release of the client (0.10.2 probably) the original expression should also work

1 Like

For fun I also had a look in a bbox where four tiles overlap (bit more south of Bogota).
This is the a mask-sum image.
Notice the factor-2 and factor-4 regions, while it should be just a 0-6 range everywhere.

Nice analysis! I logged an issue, as the backend should avoid that the user sees overlap:

1 Like

Steefaan Thanks! Great Work :wink: