Hey,
So I just wanted to build some RGB images from openeo and I found a very weird issue.
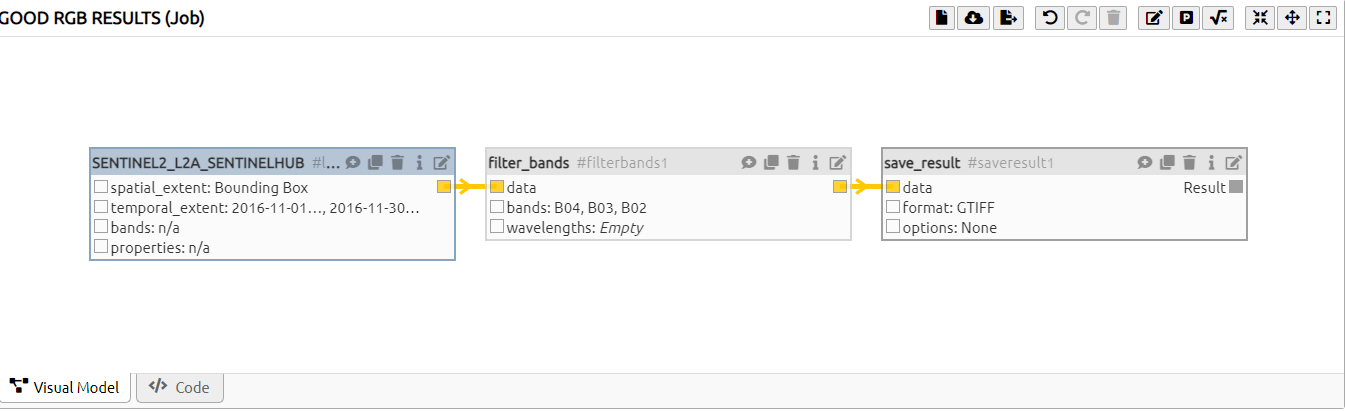
Here is my graph :
For me it looks like the easiest way to generate an RGB image but… here is what I got (plot on QGIS):
As we can see it s a single image and when you zoom in the image changes. In fact, the changes corresponds to all the images I should get for my temporal extent, it’s like a temporal overlap of images that you go through while zooming. I don’t know how is it even possible because I get a single tiff file as an output…
Finally I found the way to import rgb images from openeo with this graph :
My question is just what’s wrong with the first graph ? How is it possible to get an image like this ?
Thanks for answering !
BEHLOUL Selim
Hi Selim,
the problem with the first graph is trying to store a timeseries of images into a single geotiff. Did you perhaps use a synchronous request to get this tiff?
If you use batch, it will store a geotiff per date and should be correct.
If you want to make the synchronous result correct, either use netCDF or reduce the time dimension.
best regards,
Jeroen
1 Like
My first guess would be a caching issue in QGIS. Did you try different downloads with different temporal extents in a row and meanwhile visualizing these in QGIS? Can you reproduce this mixup effect after restarting QGIS?
Hey Stefaan.
I tried with other temporal extents and I get the same results. And yes I also get the same result after restarting QGIS…
But @jeroen.dries 's comment solves the issue.