Hey there,
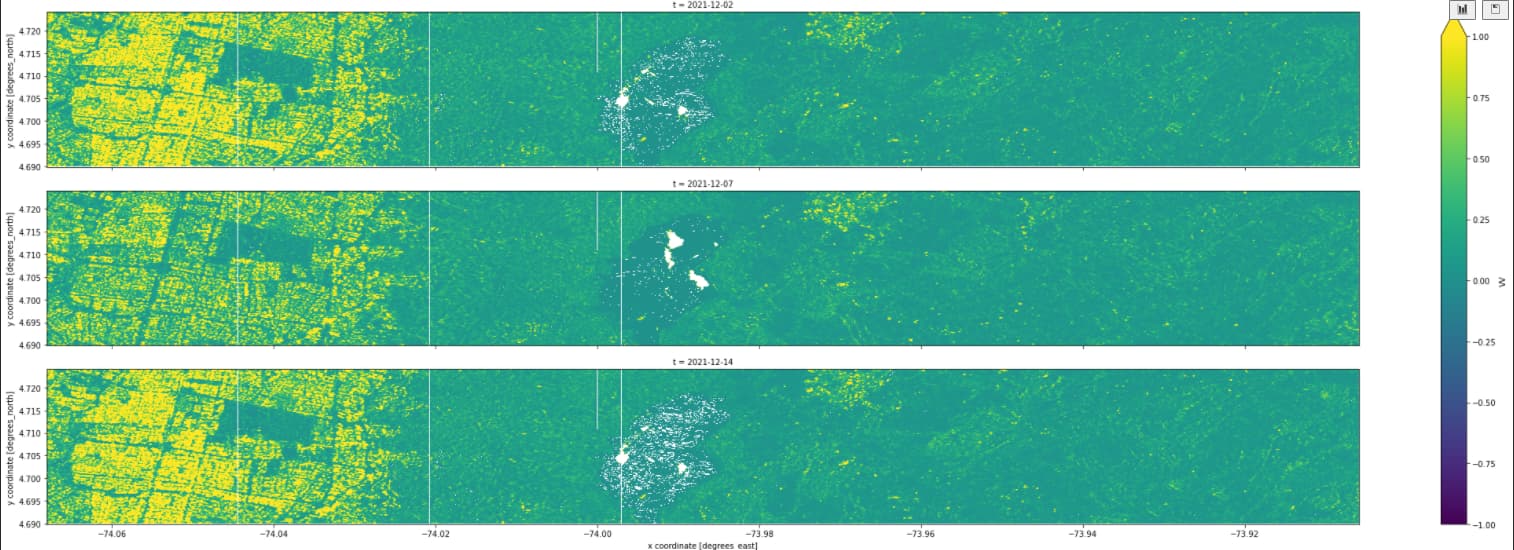
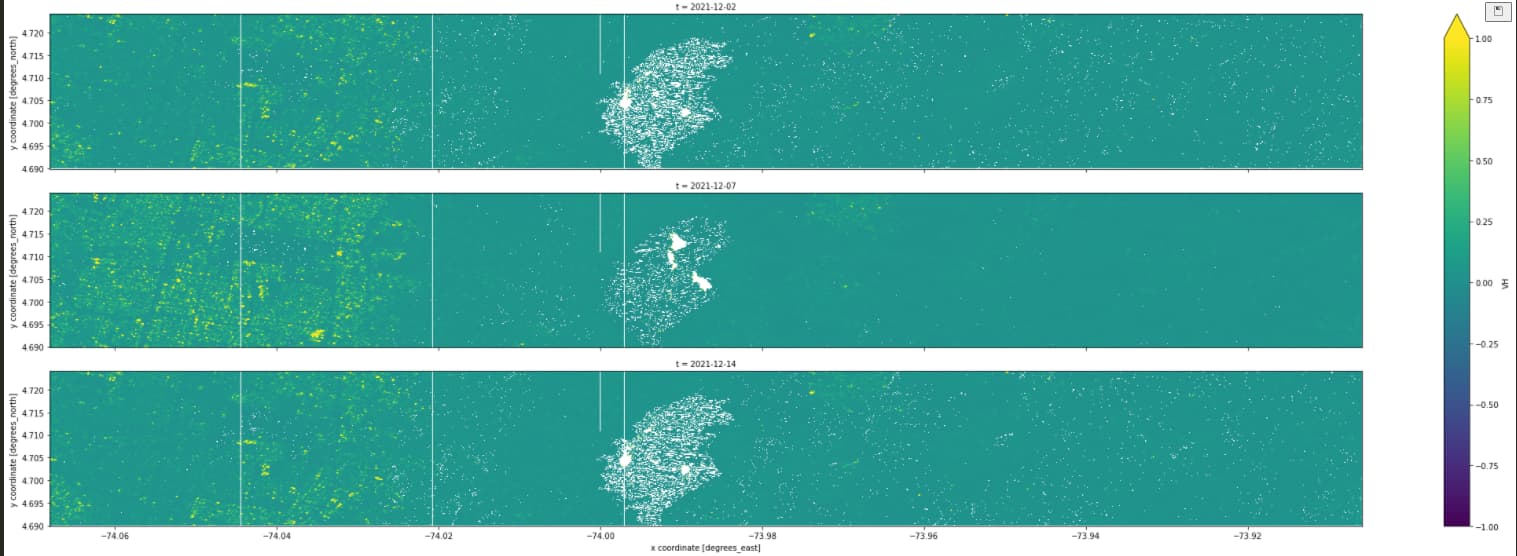
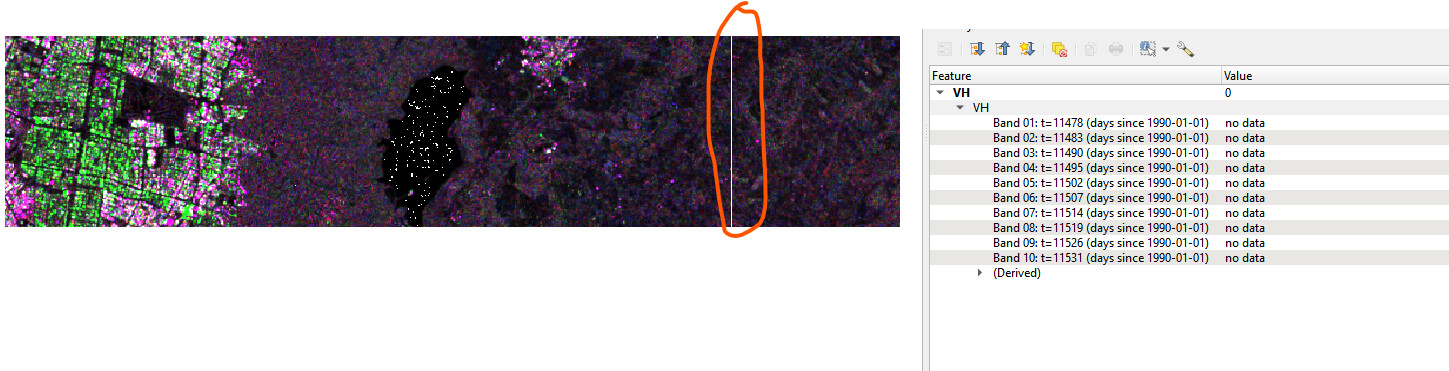
Do you know why data from the SENTINEL1_GRD collection shows missing pixels? The white spots in the images shows no data in the images. Additionally. there are white vertical strips present which should not be there.
This sctipt was used to produce the below images:
start_date = '2021-12-01'
end_date = '2021-12-31'

spatial_extent  = {'west': -74.06810760, 'east': -73.90597343, 'south': 4.689864510, 'north': 4.724080996, 'crs': 'epsg:4326'} #colombia

s1_cube = connection.load_collection(
    'SENTINEL1_GRD',
     spatial_extent = spatial_extent,
     temporal_extent = [start_date, end_date],
     bands = ['VH','VV'],
     properties = {"polarization": lambda p: p == "DV"})


s1_cube.download("s1_cube.nc")
VV output:
VH output:
FYI - We’ve tried to run the script without properties = {"polarization": lambda p: p == "DV"} and we’ve obtained the same missing pixels in scenes.
@sulova.andrea Is the data from the images a direct visualization of the s1_cube or after you applied some ard processing already?
I was able to produce similar images as you but only after running the ard_normalized_radar_backscatter. There seems to be an issue with the default DEM (which is Mapzen). I suggest you specify (elevation_model=“COPERNICUS_30”) in the backscatter process which is in general of better quality (outside of the US) and shouldn’t have those issues.
Best,
Daniel
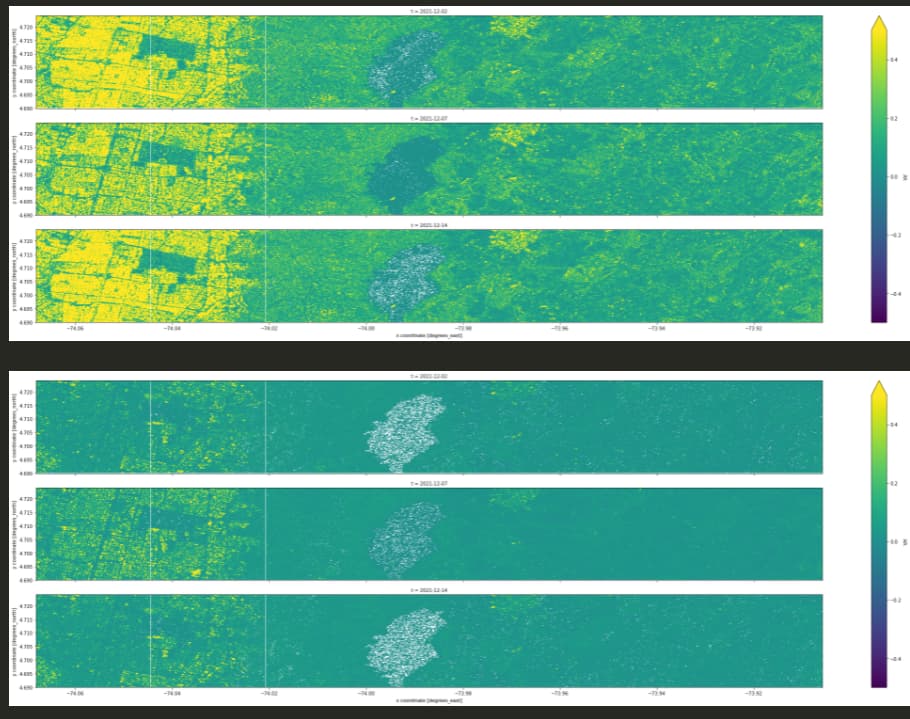
Thank you @daniel.thiex . It seems better to use ard_normalized_radar_backscatter with COPERNICUS_30 but there are still missing pixels.
Example:
Is it possible to digest the internal DEM to the ard_normalized_radar_backscatter process?
Additionally, do you know why we are getting the vertical lines in images?
@stefaan.lippens @jeroen.dries - Is there any way how to fix vertical lines on the left side of scene?
Why we are getting this artefacts?
hi, just a heads up: I’m trying to reproduce, but there seems to be a problem with SentinelHub at the moment, so I can’t even get to download something
There was a short interruption of our services on that day for 1h. Everything is up again and should be working normally again. If you notice anything strange, please let us know.
It seems that problem is still there.
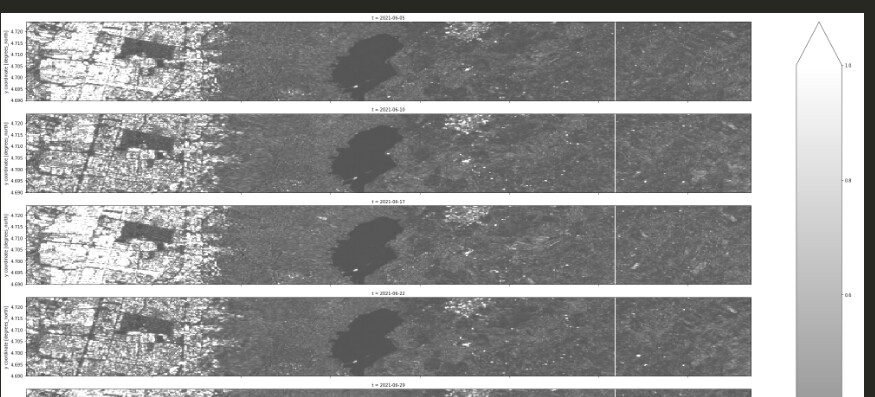
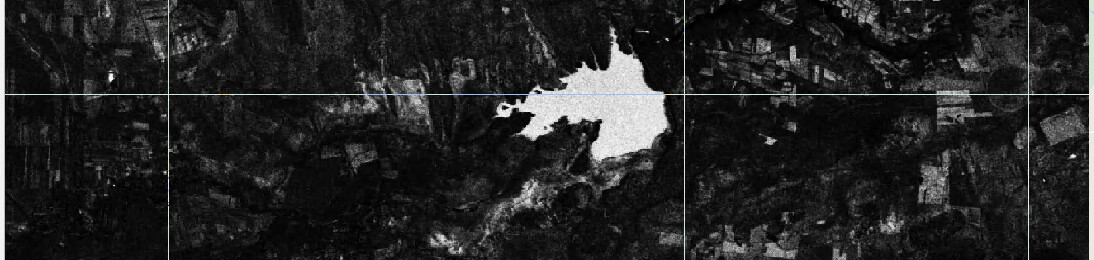
I can at most reproduce a line artifact around the -74 deg longitude meridian (north-west of that lake), but not the other lines you are seeing, e.g. in QGis:
Are we sure these lines you see aren’t just some kind of visualization issue? have you tried loading the results in another tool?
My spatial extent is bigger than yours so you can not see it.
Additionally,I can see the artifacts in your output too:
Yes that was what I was trying to explain:
- I can only reproduce that artifact near the lake, which only spans half the vertical extent
- I can not reproduce the other artifacts that span the whole vertical extent (I have the same spatial extent in my file, but zoomed in on the only artifact I could find)
I suspect these two types of artifacts have a different source: e.g. the first is a DEM issue and the second is just a visualization issue.
Can you share the netCDF you get, e.g. through email?
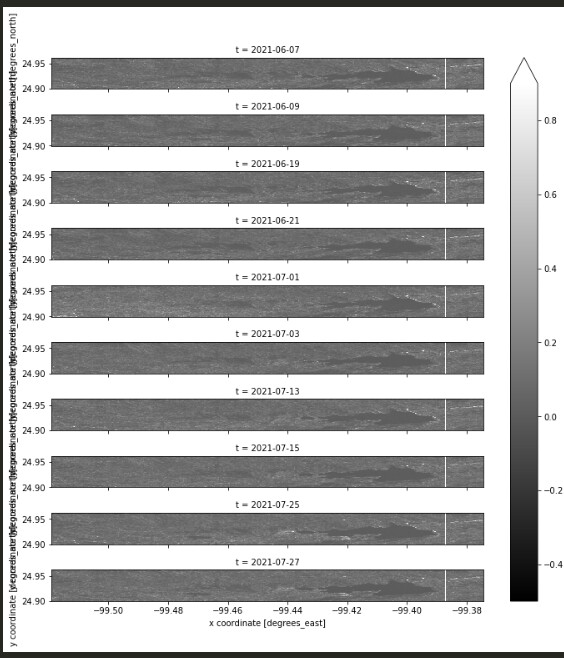
FYI - I was downloading another site and I can see the similar vertical line
{'west': -99.51913833618165, 'east': -99.37459945678712, 'south': 24.89967211146524, 'north': 24.961938324196538, 'crs': 4326}
I can see that my jobs are waiting in the line for hours. Is the server down?
Thanks for your version of the netcdf download, I can now also see the other artifact.
One think I noticed is that the the size in pixels is different for the same spatial extent:
- your file 945x400 pixels
- my result (based on your original snippet) is 1800x382 pixels
You also have 10 timestamps, while I only get 3 with the time range of you original post:
can you post an update of your code to make sure we are talking about the same use case?
Both production and dev instance of the VITO backend look fine at my end. What connection URL are you using in this case?
- I just increase the spatial extent due to checking the consistency in data:
Here the updated code:
start_date = '2021-12-01'
end_date = '2021-12-31'
s1_cube = connection.load_collection(
'SENTINEL1_GRD',
spatial_extent = {'west': -74.23921464628793, 'east': -73.59376786894418, 'south': 4.63822888776919, 'north': 4.775094862425593, 'crs': 4326},
temporal_extent = [start_date, end_date],
bands = ['VH','VV'],
properties = {"polarization": lambda p: p == "DV"})
s1_cube.download("s1_cube.nc")
- This is another place which I tested and results seems witht the same problem:
start_date = '2021-12-01'
end_date = '2021-12-31'


s1_cube = connection.load_collection(
    'SENTINEL1_GRD',
     spatial_extent = {'west': -74.23921464628793, 'east': -73.59376786894418, 'south': 4.63822888776919, 'north': 4.775094862425593, 'crs': 4326},
     temporal_extent = [start_date, end_date],
     bands = ['VH','VV'],
     properties = {"polarization": lambda p: p == "DV"})


s1_cube.download("s1_cuba.nc")
I think the spatial (and temporal) extent are the same as the other example
There you go: {'west': -99.5945352421805, 'east': -99.28125322924105, 'south': 24.888086962860328, 'north': 24.950359025232224, 'crs': 4326}